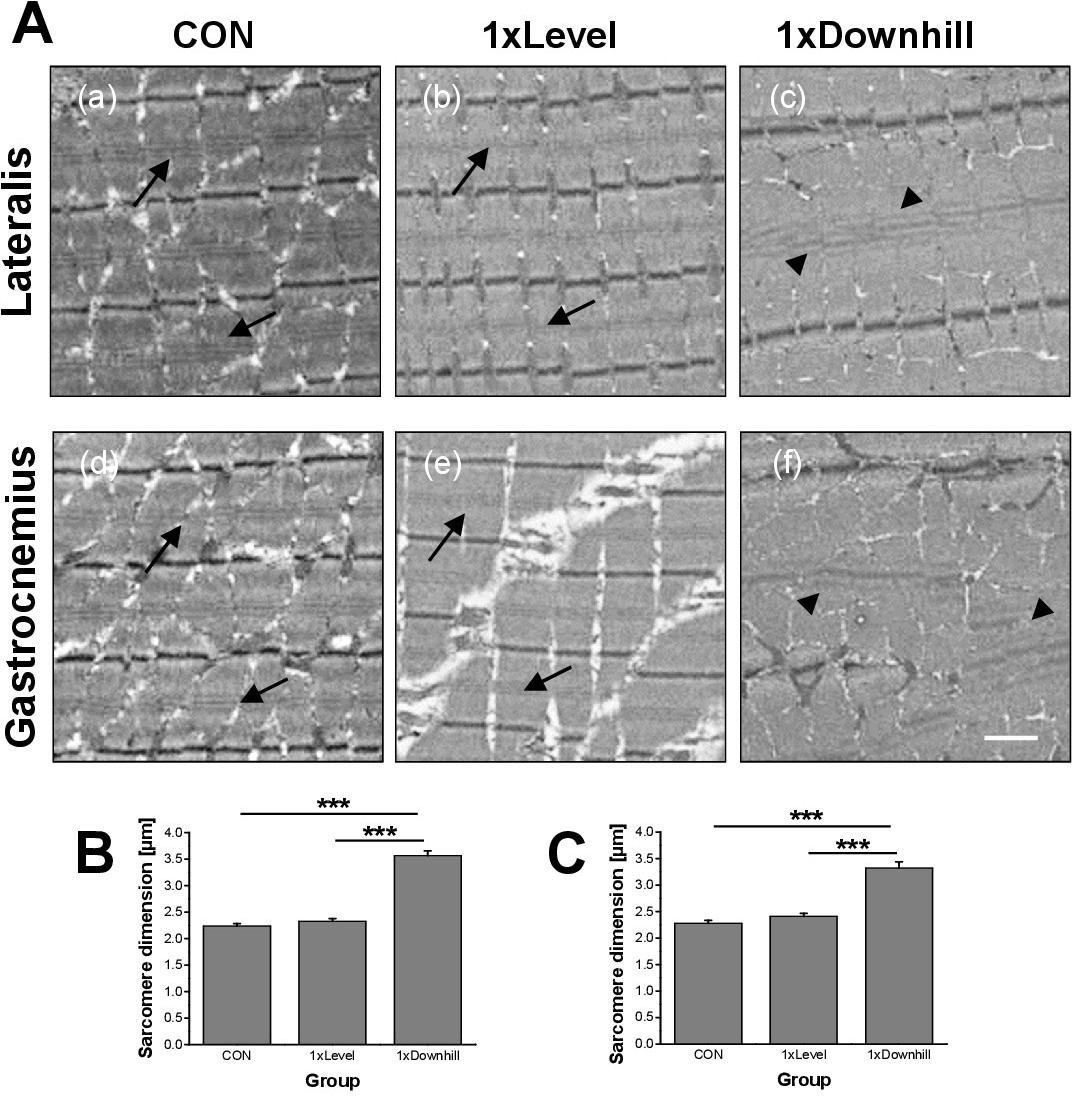
Fig. 1. Transmission electron microscopy (TEM) analysis of concentrically and eccentrically stressed muscle. (A) TEM reveals increased skeletal muscle M-band dilations (see arrow heads) after 1xDownhill compared to 1xLevel and CON conditions, which showed normal M-bands (arrows). (B, C) Quantitative analysis of sarcomeric M-band dimensions in LAT and GAS muscles and the three intervention groups demonstrates significantly increased M-band dimensions upon acute eccentric running. *** p<0.001, bar is 1 µm. Muscles from n=8 rats of each group were analyzed.